You signed in with another tab or window. Reload to refresh your session.You signed out in another tab or window. Reload to refresh your session.You switched accounts on another tab or window. Reload to refresh your session.Dismiss alert
$(function(){$('#container').highcharts({title: {text: 'Chart reflow is set to true'},subtitle: {text: 'When resizing the window or the frame, the chart should resize'},yAxis: {visible:true,labels: {formatter:function(){letyValue=this.value;if(yValue>=200){return"极佳";}elseif(yValue>=150&&yValue<200){return"非常棒";}elseif(yValue>=100&&yValue<150){return"相当棒";}elseif(yValue>=50&&yValue<100){return"还不错";}else{return"一般";}},}},series: [{data: [29.9,71.5,106.4,129.2,144.0,176.0,135.6,148.5,216.4,194.1,95.6,54.4]}]});});
Activity
littleZhangqq commentedon Jul 16, 2019
这个是我的model设置:
AAChartModel *model =  AAChartModel.new
    .chartTypeSet(AAChartTypeSpline)
    .markerSymbolSet(AAChartSymbolTypeCircle)
    .markerRadiusSet(@6)//设置折线连接点宽度为0,即是隐藏连接点
    .xAxisGridLineWidthSet(@(1))
    .yAxisGridLineWidthSet(@(1))
    .yAxisTitleSet(@"")
    .categoriesSet(@[@"提前", @"准时", @"延时"])
    .yAxisTickPositionsSet(@[@(1),@(2),@(3),@(4),@(5),@(6)])
    .subtitleSet(@"(程度)")
    .markerSymbolStyleSet(AAChartSymbolStyleTypeInnerBlank)
    .dataLabelEnabledSet(true)
    .invertedSet(true)
    .seriesSet(@[
                 AASeriesElement.new
                 .nameSet(@"时间")
                 .dataSet(@[@(1), @(2), @(2)])
                 .lineWidthSet(@3.5)
                 .zonesSet(@[]),
                 ]);
AAChartModel commentedon Jul 16, 2019
将图片直接拖拽至此文字输入框即可上传图片,怎么会没法贴图片?
littleZhangqq commentedon Jul 16, 2019
好的。。。这个是设计图
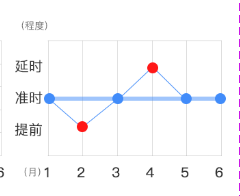
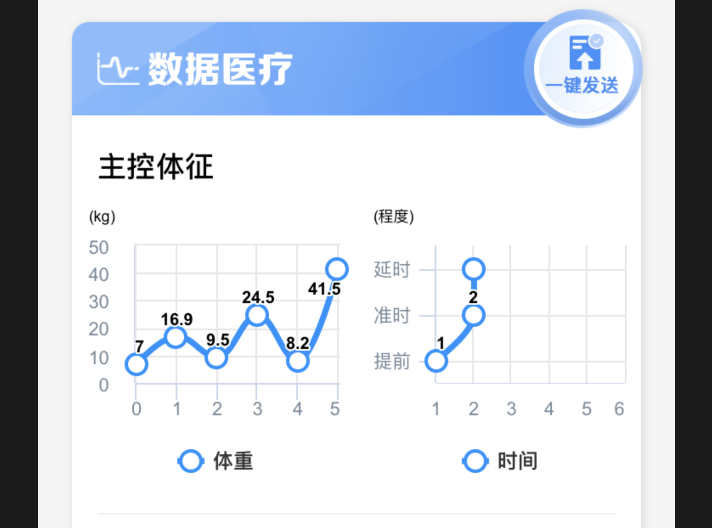
是这个样式的
y轴用汉字,x轴用数字。我用上面的代码执行完后显示的这样:
样式我可以自己来调 但是xy轴这个数据的显示搞不定。。
AAChartModel commentedon Jul 17, 2019
已为Y轴labels添加了formatter属性.使用示例如下:👇
1.配置AAOptions实例对象
AAChartModel *aaChartModel = AAChartModel.new .chartTypeSet(AAChartTypeLine)//图表类型 .titleSet(@"")//图表主标题 .subtitleSet(@"")//图表副标题 .colorsThemeSet(@[@"#04d69f",@"#1e90ff",@"#ef476f",@"#ffd066",]) .markerSymbolStyleSet(AAChartSymbolStyleTypeBorderBlank)//折线连接点样式为内部白色 .markerRadiusSet(@8) .stackingSet(AAChartStackingTypeNormal) .yAxisTitleSet(@"")//设置 Y 轴标题 .seriesSet(@[ AASeriesElement.new .nameSet(@"Tokyo Hot") .lineWidthSet(@5.0) .fillOpacitySet(@0.4) .dataSet( @[@29.9, @71.5, @106.4, @129.2, @144.0, @176.0, @135.6, @148.5, @216.4, @194.1, @95.6, @54.4]), ] ); /*Custom Tooltip Style --- 自定义图表浮动提示框样式及内容*/ AAOptions *aaOptions = [AAOptionsConstructor configureChartOptionsWithAAChartModel:aaChartModel]; aaOptions .yAxis.labels .formatterSet(@AAJSFunc(function () { let yValue = this.value; if( yValue >=200) { return "极佳"; } else if( yValue >=150 && yValue< 200 ) { return "非常棒"; } else if( yValue >=100 && yValue< 150) { return "相当棒"; } else if( yValue >=50 && yValue< 100) { return "还不错"; } else { return "一般"; } })); return aaOptions;AAChartModel commentedon Jul 17, 2019
至于如何配置formatter函数,可打开下面👇这个在线
JavaScript编辑器链接,https://jshare.com.cn/highcharts/hhhhnn
将下面的
JavaScript代码复制粘贴进去,自行更改配置在线测试littleZhangqq commentedon Jul 17, 2019
大神,按照上面给出的方法我这样写的代码:
-(AAChartModel *)aaModel{
    AAChartModel *model =  AAChartModel.new
    .chartTypeSet(AAChartTypeLine)//图表类型
    .titleSet(@"")//图表主标题
    .subtitleSet(@"")//图表副标题
    .colorsThemeSet(@[@"#04d69f",@"#1e90ff",@"#ef476f",@"#ffd066",])
    .markerSymbolStyleSet(AAChartSymbolStyleTypeBorderBlank)//折线连接点样式为内部白色
    .markerRadiusSet(@8)
    .stackingSet(AAChartStackingTypeNormal)
    .yAxisTitleSet(@"")//设置 Y 轴标题
    .seriesSet(@[
                 AASeriesElement.new
                 .nameSet(@"时间")
                 .lineWidthSet(@5.0)
                 .fillOpacitySet(@0.4)
                 .dataSet( @[@1.0, @1.5, @2.4, @1.2, @1.0, @2.0]),
                 ]
               );

    AAOptions *aaOptions = [AAOptionsConstructor configureChartOptionsWithAAChartModel:model];
    aaOptions
    .yAxis.labels
    .formatterSet(@AAJSFunc(function () {
        let yValue = this.value;
        if( yValue >=2) {
            return "提前";
        } else if( yValue >=1 && yValue< 2 ) {
            return "准时";
        } else {
            return "延时";
        }
    }));
    return model;
}
显示不出来Y轴汉字啊:
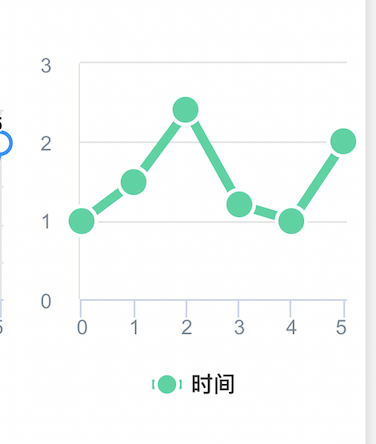
写出来效果是这样的:
AAChartModel commentedon Jul 17, 2019
需要更新一下AAChartKit,我在0ee1119
这次提交里面新加的功能.
littleZhangqq commentedon Jul 19, 2019
大佬 你这个修改的y轴文字可以是固定的吗?现在是y轴显示文字是根据dataset里的值来控制y轴文字的显示范围,比如数据10个类型,但是dataset里的值只有5种,那么y轴最多只能显示到5种,默认应该是显示10个类型范围的。请问这种的能改吗?
srx080561 commentedon Jul 22, 2020
双y轴该怎么取呢
AAChartModel commentedon Sep 10, 2020
@srx080561 现已支持双 Y 轴图表的 Y 轴Labels 的 formatter 函数
详细内容,参见问题 #952