Repository navigation
Initial working feature addition of Node --inspect Metadata Server. - #235
Will (june07) wants to merge 1 commit into
Conversation
|
|
|
You can simply set the port in your launch config to a known port. Wouldn't that be easier? This does not seem generally useful to me. |
|
There are cases where setting the port manually is not feasible. An example is when debugging multiple processes at once. Manually setting/changing ports becomes unmanageable. But further... I actually wrote this out of wanting to try VSCode more vs my normal workflow editor, while at the same time being able to use my other debugging tools (ie Chrome DevTools). I like the idea of not being required to changing so much tooling at once (editor + debugger) and instead being able to mix/match the tools I find to be the best and most appropriate at the time. The transparency this addition ads to VSCode makes it possible to do so. I'm now able to use DevTools as my debugger and VSCode as my editor if I so choose.
|

|
I think that being able to open chrome devtools on the process you are attached to in vscode would be really useful. It would be nice to have an extension that can provide that feature. I don't really think that starting a webserver from the debug adapter is the right way to do it. What you can do is use the DebugAdapterTracker API to watch for console messages from a node debug session of the pattern |
|
For those interested (working VSCode extension v0.0.1): |
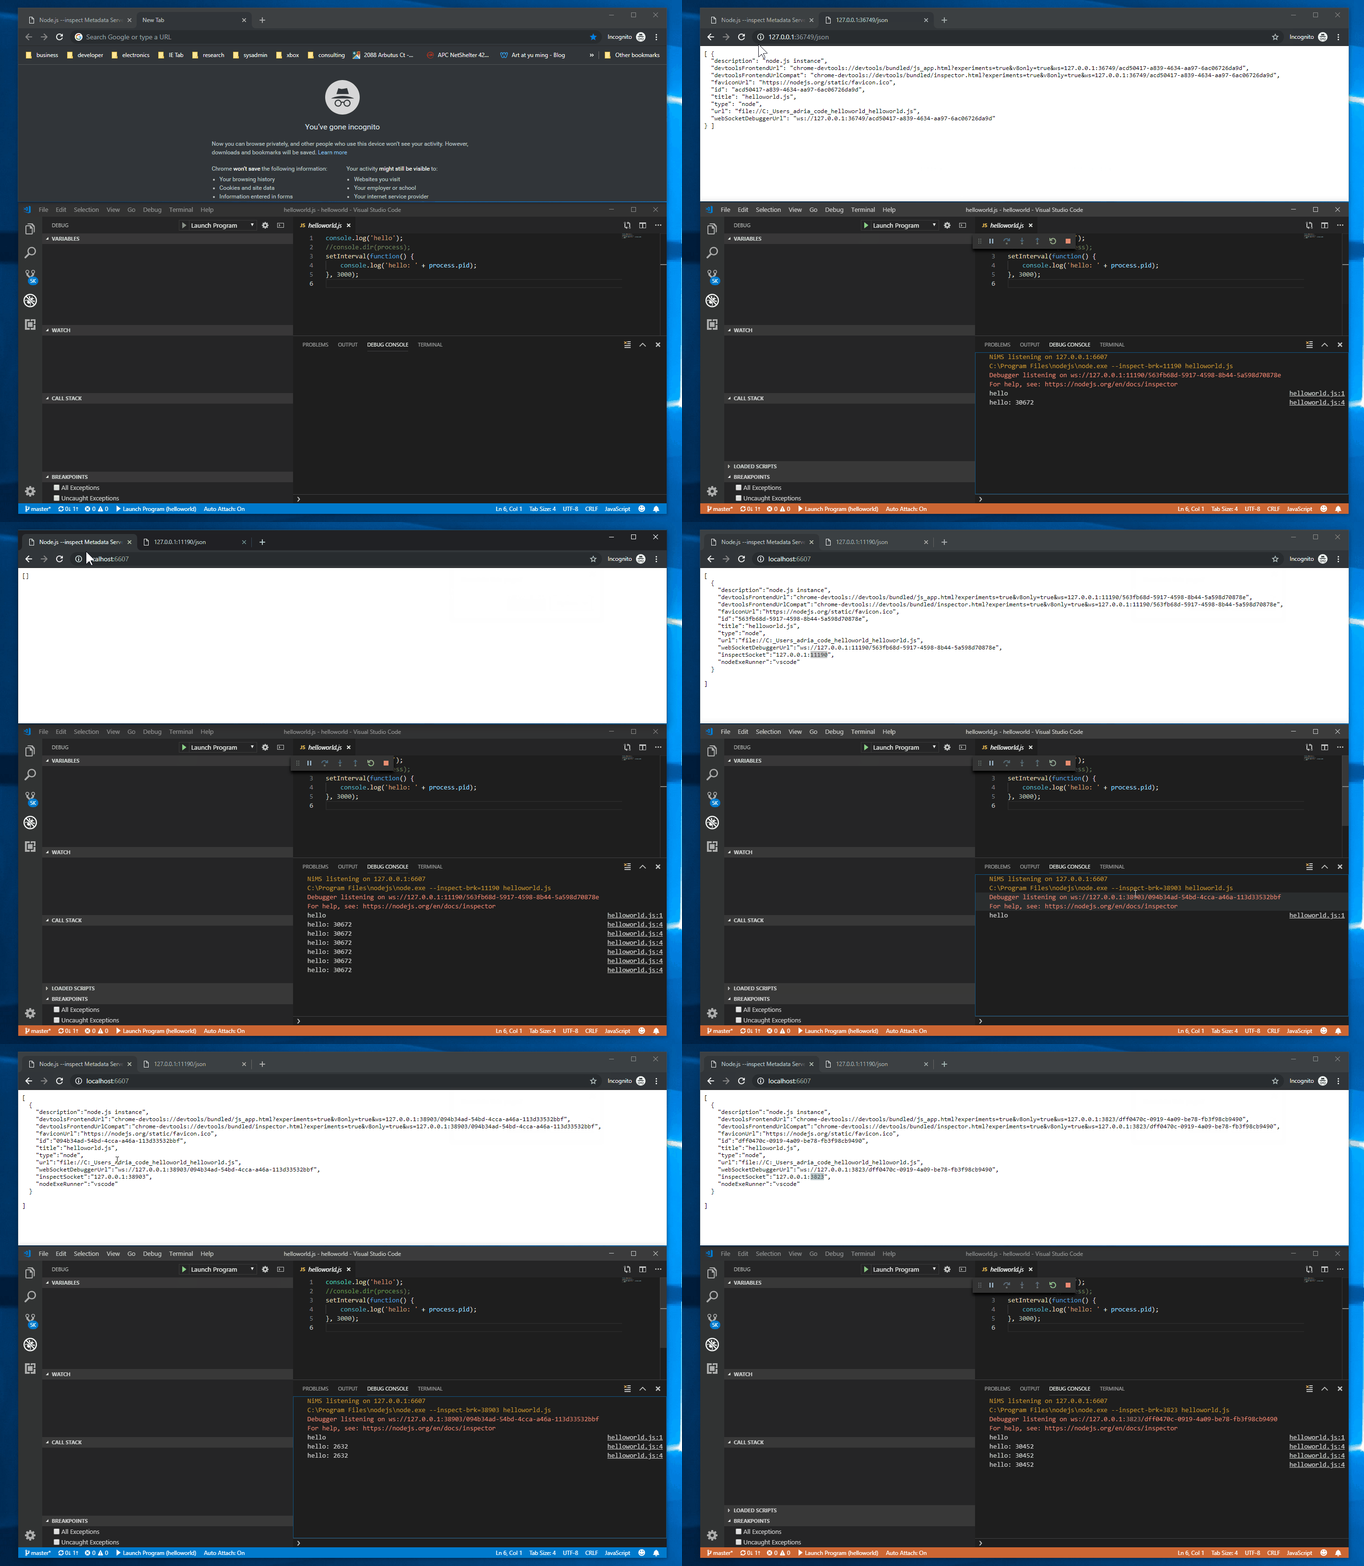
This feature would be helpful in cases where other applications need access to Node's debug socket metadata but where VSCode is the owner of the Node.js process. This addition publishes the metadata provided by the Node binary via http://localhost:9229/json to http://localhost:6607.
As VSCode calls the Node.exe such that Node chooses a random debug port, sharing this information is needed as no other way exists to know upon which port the debugger has started listening. This addition re-publishes said metadata by starting a local http instance and listening on a process independent port (tcp/6607). The metadata gathered from Node's /json URL is updated as processes are created and destroyed.
Here is an example of this in use: