Repository navigation
Colorscale attribute descriptions in cone traces are off #2723
Description
In trying out the new cone trace in plotly/plotly.py#942 I noticed that the color property for this trace type isn't included in the dist/plotly-schema.json file (at least for 1.38.2). If I understand correctly there should be a cone.color property alongside cone.colorscale, cone.cmin, etc.
Here's a screenshot of my editor with all of the property bodies collapsed.

For context, I found this because the Cone Python class generated from the schema was missing a color property 🙂
Activity
etpinard commentedon Jun 11, 2018
No this is correct. There's no
colorattribute for cones yet. Cones are colored by their corresponding u/v/w norm and that's all we allow at the moment.jonmmease commentedon Jun 11, 2018
Ok, that makes sense. Thanks for the info.
I guess the less critical issue is that the default descriptions on other color-related properties still refer to a
colorproperty.e.g. The description of
colorscalereads "Sets the colorscale and only has an effect ifcoloris set to a numerical array. ..."cminandcmaxalso have similar language.Since these descriptions will now be included as Python docstrings it would be nice to get the "u/v/w norm" language in there at some point.
And the cone trace looks awesome BTW!
[-]Cone color property not included in plotly-schema.json[/-][+]Colorscale attribute descriptions in cone traces are off[/+]etpinard commentedon Jun 11, 2018
Oops. Thanks for letting us know!
fix #2723 - list correct 'color' attribute in cone,
jzthree commentedon Jul 27, 2018
Is it a future possibility to allow user setting
colorproperty in Cone? That will be very useful like it does in other plot types.CarlAndersson commentedon Mar 7, 2019
I agree with @jzthree that direct control of the color can be really useful in some cases.
RinconFer commentedon Mar 29, 2023
Hi, It's been a long time since this issue was raised again, but I am using plotly to render UMAP embedding from scRNAseq where I use the cones direction and size to show the RNA velocity. I would like to be able to use the color variable to plot other variables (clustering, cell type, sample, latent time,...) Is there any way to change the color already? If it is still not available, is that option expected to be included soon?

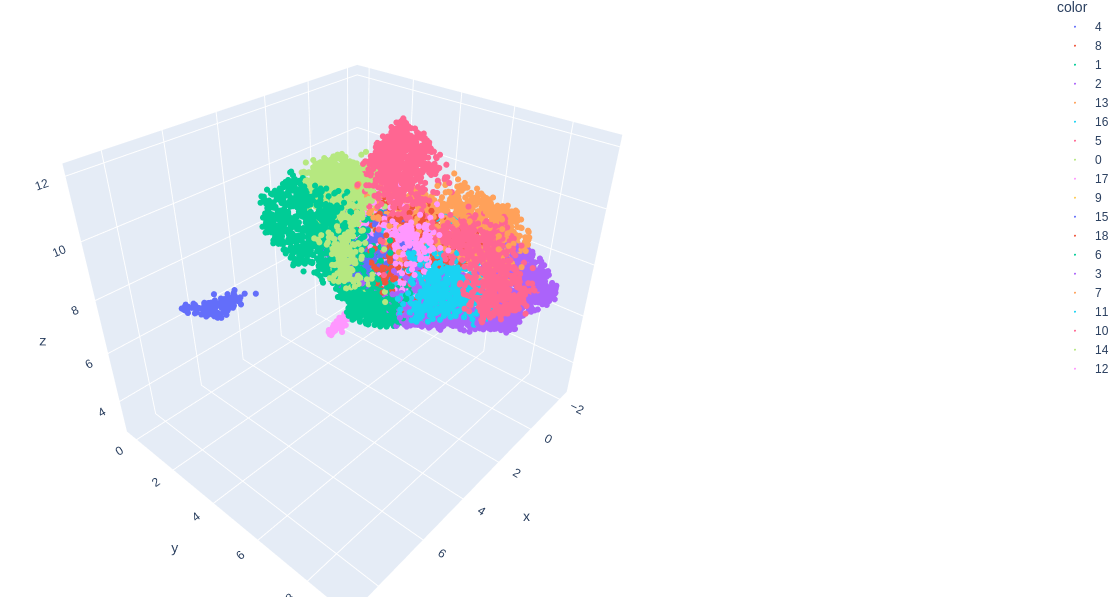
Basically I would like to combine this go.Cone figure
With the colors in this scatter_3d