Repository navigation
Conversation

|
good job. but merge failed |
|
good job. this use to my project |
|
Can you put an example for use |
|
It does work, Thanks! My version Attention, in my version, from pptx.parts.chart import ChartPart
from docx.oxml.shape import CT_Inline
Example code from docx import Document
from pptx.util import Pt, Inches
from pptx.chart.data import CategoryChartData
from pptx.enum.chart import XL_CHART_TYPE, XL_LEGEND_POSITION, XL_DATA_LABEL_POSITION
document = Document()
chart_data = CategoryChartData()
chart_data.categories = ['East', 'West', 'Midwest']
chart_data.add_series('Series 1', (19.2, 21.4, 16.7))
x, y, cx, cy = Inches(2), Inches(2), Inches(6), Inches(4.5)
chart = document.add_chart(XL_CHART_TYPE.COLUMN_CLUSTERED, x, y, cx, cy, chart_data)
chart.has_legend = True
chart.legend.position = XL_LEGEND_POSITION.BOTTOM
chart.legend.include_in_layout = False
plot = chart.plots[0]
plot.has_data_labels = True
data_labels = plot.data_labels
data_labels.font.size = Pt(13)
data_labels.position = XL_DATA_LABEL_POSITION.OUTSIDE_END
chart.has_title = True
chart_title = chart.chart_title
text_frame = chart_title.text_frame
text_frame.text = 'Title'
paragraphs = text_frame.paragraphs
paragraph = paragraphs[0]
paragraph.font.size = Pt(18)
category_axis = chart.category_axis
category_axis.tick_labels.font.size = Pt(14)
document.save('test.docx')Result You can directly download the editted files. Use the folder of |
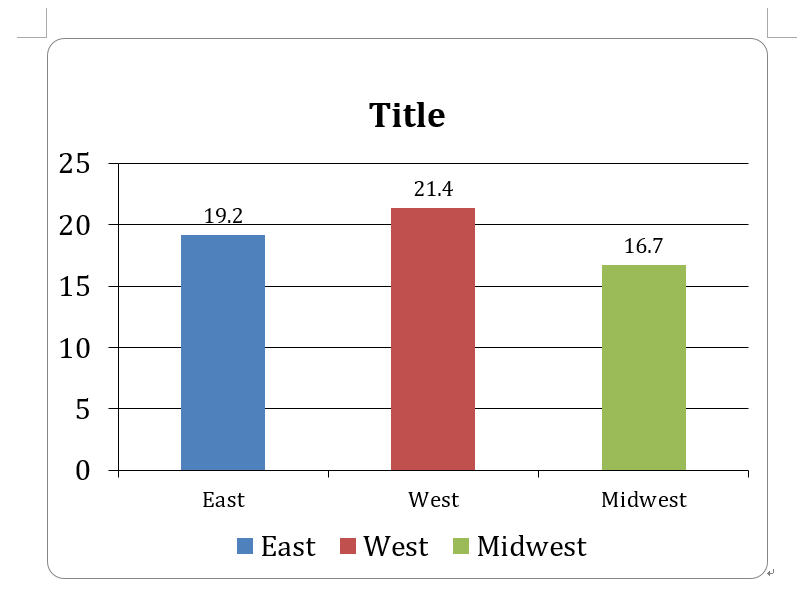
|
why chart add in run,in my opinion chart is a part. actually, what I need is replace the data in chart. I can create template myself, but I need to render the xml, and replace the chart data, autofit the axis. I think this is what most people need. |
|
can this method be used with python docx template? |
|
Is there any update on this issue? |
|
@vba34520 |
i have try to use minidom to modify the base chart.xml ,it useful,maybe you can try it too. |
|
While implementing @vba34520 's code snippet, I got this error: AttributeError: 'Document' object has no attribute 'add_chart'. |
@workamiracle You need to be using their version of |
|
Any update on this issue? |
|
请在此处获取monkey.py文件monkey.txt 示例代码: import monkey document = Document() document.save("test.docx") |
Did you find any way to remove the borders or "outlines" around the chart? |
Hi, I create a new feature branch to add new feature: add_chart for docx.
The add_chart method allow us to add chart from python-pptx to docx. I request to merge to master branch and release as v0.8.7 or something.
Best wishes.