Set max width for bar chart labels #141 - #149
Conversation

* Changes:
* Bar chart label text is limited to 50 characters (plus “. . .”
for those strings that exceed 50 and are therefore abbreviated).
Particularly noticeable (at least on “zlib-1.2.11” test scan)
for the “Copyright Statements” selection.
* Tooltip is displayed on mousing over the bar for all bar chart
selections.
* Tooltip displays the label text plus the count in parentheses.
* Replace '<' with '<' before calling tooltip -- for some reason
the open angle-bracket interrupts the tooltip display (the close
angle-bracket seems to display OK as is).
* Chart dropdown no longer has a visible focus outline/border after
a selection is made.
* Open issues:
* Adding a tooltip for the bar chart labels would be helpful since
on some display scales, the bar chart bar for some items is small
and triggering the tooltip requires precise placement. (I
researched and experimented extensively but could not figure out
how to accomplish this.)
* The “Copyright Authors” selection is displayed on launch but not
shown as selected in the dropdown’s default display. (This
behavior existed before adding the tooltip.)
* The margin/whitespace between the top of the vertical axis and
the top-most item increases as the number of displayed items
increases. Similar behavior for the bottom of the axis. This is
most pronounced (on the “zlib-1.2.11” test scan) for the
“Copyright Statements” selection (73 items displayed). (This
behavior existed before adding the tooltip.)
Signed-off-by: John M. Horan <johnmhoran@gmail.com>
Signed-off-by: John M. Horan <johnmhoran@gmail.com>
| // Create scaling for y that converts formattedData names to pixels | ||
| let yScale = d3.scale.ordinal() | ||
| .domain(formattedData.map(function(d) {return d.name; })) | ||
| .domain(formattedData.map(function(d) {return d.trimName; })) |
There was a problem hiding this comment.
I think we want to use the full name here. Consider the case where two names only differ on character 51 and we truncate on character 50.
   [
       "some...long...name1"
       "some...long...name2"
   ]
After truncation we would get:
  [
      "some...long...name"
      "some...long...name"
  ]
Each bar in the chart needs a distinct name in the y-axis "domain" in order to be drawn at a distinct height along the y-axis. In the case above, there would be no way for the y axis to distinguish the names, and you would probably get overlapping bars at that same position instead of two different bars at different heights.
It looks like one possible solution might use be to use the d3 axis's .tickFormat() to set the names of the labels different from the domain of the y-axis.
| } | ||
|
|
||
| /* Tooltip for Bar Chart */ | ||
| .toolTip { |
| // Transform license count into array of objects with license name & count | ||
| let chartData = $.map(count, function(val, key) { | ||
| let trimName = ""; | ||
| if (key.length > 50) { |
There was a problem hiding this comment.
style nit: you could use a ternary operator here:
trimName = key.substring(0, 50) + (key.length > 50 ? " ..." : "");
| .attr('height', yScale.rangeBand()); | ||
| .attr('y', function(d) { return yScale(d.trimName); }) | ||
| .attr('height', yScale.rangeBand()) | ||
| .on("mouseover", function (d) { tooltip.style("display", "inline-block"); }) |
There was a problem hiding this comment.
We should also have a tooltip on the y-axis label. I've noticed some cases where the bar is so small that there's actually no way to trigger the tooltip.
  * Update local branch with changes to 'develop'.

Signed-off-by: John M. Horan <johnmhoran@gmail.com>
  * Bar chart labels now have tooltips with same content as
    corresponding bars.
  * Changed from truncated name to full name as appropriate.

Signed-off-by: John M. Horan <johnmhoran@gmail.com>
 jdaguil
left a comment
jdaguil
left a comment
There was a problem hiding this comment.
Added a few comments. :) Also, can you merge develop into your branch?
|
|
||
| // Transform license count into array of objects with license name & count | ||
| let chartData = $.map(count, function(val, key) { | ||
| let trimName = ""; |
There was a problem hiding this comment.
Assigning to an empty string is unneeded. Instead do this:
let trimName = key.substring(0, 50) + (key.length > 50 ? " ..." : "");
There was a problem hiding this comment.
Done -- using the modified variable name and the new static method:
let trimmedName = BarChart.trimName(key);
| .scale(yScale) | ||
| // Limit label length to 50 characters plus ellipses. | ||
| .tickFormat(function(d) { | ||
| return d.substring(0, 50) + (d.length > 50 ? " ..." : ""); |
There was a problem hiding this comment.
This same logic is defined below. Can you refactor this out into a function?
There was a problem hiding this comment.
Good point as always @jdaguil . I've created a static method: static trimName(name) {}; changed the variable trimName to trimmedName; and called the method like this: trimmedName = BarChart.trimName(key);.
| // Clear tooltip div created when inadvertently triggered during dropdown selection. | ||
| $( ".toolTip" ).remove(); | ||
|
|
||
| let tooltip = d3.select("body").append("div").attr("class", "toolTip"); |
There was a problem hiding this comment.
This is a little confusing since it is defined after it's used above. Can you move this up?
There was a problem hiding this comment.
I moved 89-92 together -- .remove has to be called before we define the tooltip variable.
| tooltip | ||
| .style("left", d3.event.pageX - 50 + "px") | ||
| .style("top", d3.event.pageY - 70 + "px") | ||
| .style("display", "inline-block") |
There was a problem hiding this comment.
Is this needed since you set the display on mouseover?
There was a problem hiding this comment.
You're right -- line 84 is redundant. Gone.
| .style("left", d3.event.pageX - 50 + "px") | ||
| .style("top", d3.event.pageY - 70 + "px") | ||
| .style("display", "inline-block") | ||
| .html((d.name.replace('<', '<') + ' (' + d.val + ')')); |
There was a problem hiding this comment.
This can be changed to:
.text((d.name + ' (' + d.val + ')'));
.html is used to insert html. You simply want to display text.
There was a problem hiding this comment.
Thanks @jdaguil -- and I see the reference in the D3 3.x API.
| chart.selectAll(".y.axis .tick") | ||
| .on("mouseover", function (d) { tooltip.style("display", "inline-block"); }) | ||
| .on("mousemove", function (d) { | ||
| let id = d; |
There was a problem hiding this comment.
Same comment as above (renaming variable)
There was a problem hiding this comment.
Both redundant variables are now gone.
| .on("mouseover", function (d) { tooltip.style("display", "inline-block"); }) | ||
| .on("mousemove", function (d) { | ||
| let id = d; | ||
| let displayValue = ''; |
There was a problem hiding this comment.
Same comment as above (setting variable to an empty string)
| tooltip | ||
| .style("left", d3.event.pageX - 50 + "px") | ||
| .style("top", d3.event.pageY - 70 + "px") | ||
| .style("display", "inline-block") |
| .style("left", d3.event.pageX - 50 + "px") | ||
| .style("top", d3.event.pageY - 70 + "px") | ||
| .style("display", "inline-block") | ||
| .html((d.replace('<', '<') + displayValue)); |
| let id = d; | ||
| let displayValue = ''; | ||
| let result = $.grep(summaryData, function (e) { return e.name === id; }); | ||
| displayValue = (result.length === 1 ? ' (' + result[0].val + ')' : ''); |
There was a problem hiding this comment.
Do we need this? Shouldn't there always be a result?
Signed-off-by: John M. Horan <johnmhoran@gmail.com>
  * One note: retained this line of code because it’s needed, at least
    on Windows, but for some reason Jillian has not been able to
    reproduce on Mac: $( ".toolTip" ).remove();

Signed-off-by: John M. Horan <johnmhoran@gmail.com>
|
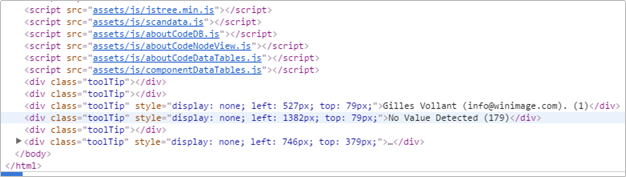
@jdaguil Just pushed my refactoring/cleaning based on your comments. There's one item that may still be open. You asked whether we need to retain this line of code: I added this code to prevent the unwanted div growth, and placing it just before we define the What do you see on your Mac when you comment out the line of code? |

|
@johnmhoran regarding #149 (comment) I misunderstood the issue in the code comment. I understand what you were trying to accomplish now, and it's fine. |
jdaguil
left a comment
There was a problem hiding this comment.
Looking good! I've added a few small style nits
| let yAxis = d3.svg.axis() | ||
| .scale(yScale) | ||
| // Limit label length to 50 characters plus ellipses. | ||
| .tickFormat(function(d) { |
There was a problem hiding this comment.
I think this can be rewritten as:
.tickFormat(BarChart.trimName)
|
|
||
| // Transform license count into array of objects with license name & count | ||
| let chartData = $.map(count, function(val, key) { | ||
| let trimmedName = BarChart.trimName(key); |
There was a problem hiding this comment.
This is short enough now to where you can just move it into the object if you want:
trimmedName: BarChart.trimName(key);
Signed-off-by: John M. Horan <johnmhoran@gmail.com>
|
LGTM! 👍 |
Changes:
for those strings that exceed 50 and are therefore abbreviated).
Particularly noticeable (at least on “zlib-1.2.11” test scan)
for the “Copyright Statements” selection.
selections.
the open angle-bracket interrupts the tooltip display (the close
angle-bracket seems to display OK as is).
a selection is made.
Open issues:
on some display scales, the bar chart bar for some items is small
and triggering the tooltip requires precise placement. (I
researched and experimented extensively but could not figure out
how to accomplish this.)
shown as selected in the dropdown’s default display. (This
behavior existed before adding the tooltip.)
the top-most item increases as the number of displayed items
increases. Similar behavior for the bottom of the axis. This is
most pronounced (on the “zlib-1.2.11” test scan) for the
“Copyright Statements” selection (73 items displayed). (This
behavior existed before adding the tooltip.)
Signed-off-by: John M. Horan johnmhoran@gmail.com