Set max width for bar chart labels #141 #149
There are no files selected for viewing
| Original file line number | Diff line number | Diff line change |
|---|---|---|
|
|
@@ -50,7 +50,7 @@ class BarChart { | |
|
|
||
| // Create scaling for y that converts formattedData names to pixels | ||
| let yScale = d3.scale.ordinal() | ||
| .domain(formattedData.map(function(d) {return d.trimName; })) | ||
|
Contributor
There was a problem hiding this comment. I think we want to use the full name here. Consider the case where two names only differ on character 51 and we truncate on character 50. After truncation we would get: Each bar in the chart needs a distinct name in the y-axis "domain" in order to be drawn at a distinct height along the y-axis. In the case above, there would be no way for the y axis to distinguish the names, and you would probably get overlapping bars at that same position instead of two different bars at different heights. It looks like one possible solution might use be to use the d3 axis's |
||
| .rangeRoundBands([0, chartHeight], 0.1 /* white space percentage */); | ||
|
|
||
| // Creates a d3 axis given a scale (takes care of tick marks and labels) | ||
|
|
@@ -69,11 +69,25 @@ class BarChart { | |
| .enter().append('g'); | ||
|
|
||
| this.rects = bars.append('rect') | ||
| .attr('y', function(d) { return yScale(d.trimName); }) | ||
| .attr('height', yScale.rangeBand()) | ||
| .on("mouseover", function (d) { tooltip.style("display", "inline-block"); }) | ||
|
Contributor
There was a problem hiding this comment. We should also have a tooltip on the y-axis label. I've noticed some cases where the bar is so small that there's actually no way to trigger the tooltip. |
||
| .on("mousemove", function (d) { | ||
| tooltip | ||
| .style("left", d3.event.pageX - 50 + "px") | ||
| .style("top", d3.event.pageY - 70 + "px") | ||
| .style("display", "inline-block") | ||
|
Contributor
There was a problem hiding this comment. Is this needed since you set the display on mouseover?
Member
Author
There was a problem hiding this comment. You're right -- line 84 is redundant. Gone. |
||
| .html((d.name.replace('<', '<') + ' (' + d.val + ')')); | ||
|
Contributor
There was a problem hiding this comment. This can be changed to:
Member
Author
There was a problem hiding this comment. Thanks @jdaguil -- and I see the reference in the D3 3.x API. |
||
| }) | ||
| .on("mouseout", function (d) { tooltip.style("display", "none"); }); | ||
|
|
||
| // Clear tooltip div created when inadvertently triggered during dropdown selection. | ||
| $( ".toolTip" ).remove(); | ||
|
Contributor
There was a problem hiding this comment. I couldn't reproduce the problem you described in your comment. Is this still needed?
Member
Author
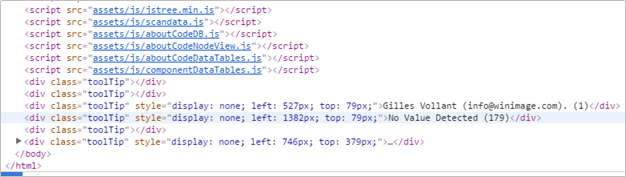
There was a problem hiding this comment. @jdaguil This is needed at least on Windows 10. Using the When I comment out the code, a new div is created each time a different attribute is selected for display: I take it you see different behavior on your Mac? |
||
|
|
||
| let tooltip = d3.select("body").append("div").attr("class", "toolTip"); | ||
|
Contributor
There was a problem hiding this comment. This is a little confusing since it is defined after it's used above. Can you move this up?
Member
Author
There was a problem hiding this comment. I moved 89-92 together -- |
||
|
|
||
| this.texts = bars.append('text') | ||
| .attr('y', function(d) { return yScale(d.trimName); }) | ||
| .attr('dy', '1.2em') | ||
| .text(function(d){ return '(' + d.val + ')'; }) | ||
| .style('text-anchor', 'start'); | ||
|
|
@@ -121,7 +135,7 @@ class BarChart { | |
|
|
||
| // Returns the pixel width of the string with the longest length | ||
| maxNameWidth(data) { | ||
| let names = data.map(function(d) { return d.trimName; }); | ||
|
|
||
| let maxStr = ''; | ||
| $.each(names, function(i, name) { | ||
|
|
@@ -149,8 +163,15 @@ class BarChart { | |
|
|
||
| // Transform license count into array of objects with license name & count | ||
| let chartData = $.map(count, function(val, key) { | ||
| let trimName = ""; | ||
|
Contributor
There was a problem hiding this comment. Assigning to an empty string is unneeded. Instead do this:
Member
Author
There was a problem hiding this comment. Done -- using the modified variable name and the new static method: |
||
| if (key.length > 50) { | ||
|
Contributor
There was a problem hiding this comment. style nit: you could use a ternary operator here: |
||
| trimName = key.substring(0, 50) + ' . . .' | ||
| } else { | ||
| trimName = key; | ||
| } | ||
| return { | ||
| name: key, | ||
| trimName: trimName, | ||
| val: val | ||
| }; | ||
| }); | ||
|
|
||

There was a problem hiding this comment.
Choose a reason for hiding this comment
The reason will be displayed to describe this comment to others. Learn more.
nit: remove extra space.