Repository navigation
Actually absolute sizemode for cones #3613
Description
Activity
This is extremely annoying. I made a stack exchange post where this issue is evident. The docstring for sizeref in
cone/attributes.jsstates:'Adjusts the cone size scaling.',
'The size of the cones is determined by their u/v/w norm multiplied a factor andsizeref.',
'This factor (computed internally) corresponds to the minimum "time" to travel across',
'two successive x/y/z positions at the average velocity of those two successive positions.',
'All cones in a given trace use the same factor.',
'Withsizemodeset to scaled,sizerefis unitless, its default value is 0.5',
'Withsizemodeset to absolute,sizerefhas the same units as the u/v/w vector field,',
'its the default value is half the sample's maximum vector norm.'But this "internal factor" is completely mysterious and I have been trying to track down where it is calculated within the code but have so far been unsuccessful.
Reacted by Martin Thøgersen and Bijan Sayyafzadeh'This factor (computed internally) corresponds to the minimum "time" to travel across',
'two successive x/y/z positions at the average velocity of those two successive positions.',Here's how we do that -> https://github.com/gl-vis/gl-cone3d/blob/90c67d0933e8a01ea77c429aacf03644d0f607ba/cone.js#L193-L199
'This factor (computed internally) corresponds to the minimum "time" to travel across',
'two successive x/y/z positions at the average velocity of those two successive positions.',Here's how we do that -> https://github.com/gl-vis/gl-cone3d/blob/90c67d0933e8a01ea77c429aacf03644d0f607ba/cone.js#L193-L199
@etpinard Thanks for your reply. This hidden factor is definitely responsible for the varying cone size in the above linked stackexchange plot but I am not able to see how. I have two cones rotating about each other on a circle at constant angular velocity thus
V.distance(p2,p)is always 2 and similarly the velocity is always 1 sovectorScaleshould have a constant value of 2 as far as I can see but this is not the case since the cones shrink to 0 when they are diametrically opposed along the x or y axis and maximal in size when 45 degrees to the axes. If you could take a look at my code (which is the simplest example of the problem i can think of) and see what's going wrong I would greatly appreciate it!Otherwise, I would vote to remove the this hidden scaling factor since all it appears to do is cause grief and pain.
@TakodaS can you share an example of one of your use cases to help us understand the challenges you're facing?
The reason we're computing a scaling factor internally is to make "most" cone traces look good by default. By "good", we mean: (1) make all the cones visible, (2) avoid overlaps, (3) not slow things down too much (i.e. keep algo O(n)).
Point taken, there's probably a better algorithm out there; it would be nice if you could help us find it. Thank you.
@etpinard From the linked stackexchange post:
import numpy as np
import plotly.graph_objs as go
import plotly.offline as pl

###np.around used because plotly.js doesn't like full precision float64s
t = np.linspace(0,2*np.pi,100)
x = np.around(np.vstack((np.cos(t), np.cos(t+np.pi))),decimals=6)
y = np.around(np.vstack((np.sin(t), np.sin(t+np.pi))),decimals=6)
z = np.around(np.vstack((np.ones(len(t)),np.ones(len(t)))),decimals=6)

v = np.around(np.vstack((np.cos(t), np.cos(t+np.pi))),decimals=6)
u = np.around(-np.vstack((np.sin(t), np.sin(t+np.pi))),decimals=6)
w = np.around(np.vstack((np.zeros(len(t)),np.zeros(len(t)))),decimals=6)

fig3=go.Figure([dict(anchor="cm",showscale=True,sizemode="scaled",type="cone",x=x[:,0],y=y[:,0]
                                        ,z=z[:,0]
                                        ,u=u[:,0],v=v[:,0]
                                        ,w=w[:,0])],layout=go.Layout(
    scene=dict(aspectratio=dict(x=1,y=1,z=0.25),
                    xaxis=dict(range=[-2,2], tickmode="linear"),
                    yaxis=dict(range=[-2,2], tickmode="linear"),
                    zaxis=dict(range=[0,5]))))

fig3.frames= [go.Frame(data=[dict(type="cone",x=x[:,i],y=y[:,i],z=z[:,i],u=u[:,i],v=v[:,i],w=w[:,i])],
                             layout=go.Layout(annotations=[dict(text="frame {}".format(i))]))for i in np.array(range(len(t)))]

pl.plot(fig3)
I am using plotly.py to animate 2 cones circling around each other. As you can see, the size of the plotted glyphs varies dramatically as the cones circle each other. I don't understand why this happens but it must be a property of the hidden internal scale factor since if I plot only 1 cone the glyph size remains constant (thus suggesting it's a function of displacement between cones).
Point taken, there's probably a better algorithm out there; it would be nice if you could help us find it.
I think the algorithm is fine but it needs to be accessible to the user. May i suggest adding an option to the attribute sizemode that deactivates this internal scaling? Perhaps call it explicit? I can't think of a better name right now.
Reacted by Bijan Sayyafzadeh@etpinard One thing that would really help is if I knew how plotly interfaces with gl-vis. As far as i can see they are completely separate packages so I still have no idea where in the plotly.js source this hidden factor is calculated and I can't find where plotly calls gl-vis. If I knew where gl-cone3d comes into all of this I could try and fix it myself.
EDIT: Ignore this, right in traces/cone/convert.js there it is.
@etpinard I can also give you my use case. I'm visualising force fields where the magnitudes are varying wildly, but the direction of the force is very relevant regardless of the magnitude. What I would like to do in the end is to set all cone lengths to be constant and have manual control of the colors as well. Since I know exactly on what mesh I will calculate the force I know exactly what scaling is appropriate. It's then very annoying to reverse-engineer some automatic scaling just to apply my already known one.
Since I'm using the python api and have no real understanding of javascript, porting the implemented algorithm is not as easy as it might seem.Related issue on the colors: #2723
I have recreated the problem using plotly.js without the python interface
#cone_data.py
"""outputs csv data to be plotted"""

import numpy as np
import pandas as pd

decimals=2
t = np.linspace(0,2*np.pi,100)
x = np.around(np.vstack((np.cos(t), np.cos(t+np.pi))),decimals=decimals)
y = np.around(np.vstack((np.sin(t), np.sin(t+np.pi))),decimals=decimals)
z = np.around(np.vstack((np.ones(len(t)),np.ones(len(t)))),decimals=decimals)

v = np.around(np.vstack((np.cos(t), np.cos(t+np.pi))),decimals=decimals)
u = np.around(-np.vstack((np.sin(t), np.sin(t+np.pi))),decimals=decimals)
w = np.around(np.vstack((np.zeros(len(t)),np.zeros(len(t)))),decimals=decimals)

stack_out = np.hstack([x.T,y.T,z.T,u.T,v.T,w.T])
df = pd.DataFrame(stack_out, columns= ["x1","x2","y1","y2","z1","z2","u1","u2","v1","v2","w1","w2"])
df.to_csv("data.csv")
Then plot
data.csv:data = Plotly.d3.csv("data.csv", function(err, rows){ function unpack(rows, key) { return rows.map(function(row) { return row[key]; }); } var x1 = unpack(rows, "x1"); var x2 = unpack(rows, "x2"); var y1 = unpack(rows, "y1"); var y2 = unpack(rows, "y2"); var z1 = unpack(rows, "z1"); var z2 = unpack(rows, "z2"); var u1 = unpack(rows, "u1"); var u2 = unpack(rows, "u2"); var v1 = unpack(rows, "v1"); var v2 = unpack(rows, "v2"); var w1 = unpack(rows, "w1"); var w2 = unpack(rows, "w2"); var data = [{ type: "cone", x: [x1[0],x2[0]], y: [y1[0],y2[0]], z: [z1[0],z2[0]], u: [u1[0],u2[0]], v: [v1[0],v2[0]], w: [w1[0],w2[0]], sizemode: "absolute", sizeref: 2, anchor: "tip", colorbar: { x: 0, xanchor: "right", side: "left" } }] var layout = { scene: { xaxis: {range:[-2,2]}, yaxis: {range:[-2,2]}, zaxis: {range:[-2,2]}, aspectmode: "cube", <!-- domain: {x: [0, 1]}, --> camera: { eye: {x: -1.57, y: 1.36, z: 0.58} } }, width: 800, } frames = [] for (var i=1; i<x1.length; i++){ frames.push({ data: [{ x: [x1[i],x2[i]], y: [y1[i],y2[i]], z: [z1[i],z2[i]], u: [u1[i],u2[i]], v: [v1[i],v2[i]], w: [w1[i],w2[i]]}], }) } Plotly.newPlot('graph', data,layout).then(function () { Plotly.addFrames('graph', frames);}).then(function(){ Plotly.animate('graph',null, {frame: {duration: 1}}); }); })As you can see the size of the cones fluctuates greatly in the same way as with the plotly.py script.
EDIT: @etpinard I can confirm that replacing the scale factor behaviour with
vectorScale=1;in dist/plotly.js completely fixes the problem. May i suggest that the attributessizerefandsizemodebe merged into a single attribute calledsize. From here we can then set the other options throughsize: {sizeref: scalar or list, sizemode: unchanged, autoscale: bool}with the two major changes that 1) the autoscaling of the glyphs can be accessed and turned on or off and 2) sizeref can now take a list which specifies the relative size of each glyph. I think this will work very well and I will try to code this up and create a pull request but I am not an experienced JS programmer.
Reacted by Matthias Zeeman and Bijan Sayyafzadeh@CarlAndersson I have uploaded a fix for Plotly.py that disables the autoscaling so that the cone size is constant and specified by
sizeref. Just pull from my repo. I am also attempting to see wheither I can easily modifysizerefin the way described above.@TakodaS Hello,
I am having the same trouble with the internal scaling factor. My issue arises from having a point cloud of the uniformly sampled contour of a sphere. I then calculate the normal for each point and after some processing have several clusters of points that belong together. Those clusters shall be outputted as cones in different colours.
I do this via an array of 'data' elements. One data element per cluster. As plotly generates a new view for each data element, points may be close together and probably also due to the irregularity of the grid, the size of the cones in some clusters is calculated so small that they are no more visible. I think it is highly probable that the internal scaling is the issue.
Unfortunately pulling a repo outside of the official release is an option I do not wish to take. Is there a way to calculate that internal scaling factor inside my own script? If not, where can I find the lines of code in Plotly.py that are calculating this factor?
Thank you!
@msntag Take a look at
plotly.py/plotly/package_data/. This folder contains the underlying js code that runs plotly. You will see a file plotly.min.js. This is a compressed version of the fileplotly.jsthat you need to edit. I simply commented out the line that computes the internal scaling factor then rewrote the python code so that any html files printed out writesrc=plotly.jsrather thansrc=plotly.min.js. That's what I did for my repo, nothing more. I would suggest perhaps git diffing the folders plotly/offline and plotly/package_data with the official release to get a better idea of what i'm doing.Edit: why not just clone my repo and try whatever file you are running as a test? I think that will tell you whether internal scaling is a problem or not.
@etpinard
Please allow me to comment on the issue and details reported by @TakodaS (thank you very much!), and the use cases brought up by @CarlAndersson and @msntag.The automatic cone scaling delivers great default results. For some special use cases, however, a more fine-grained control over the scaling of glyph size and color would be extremely helpful. For instance, to prevent changes in scaling between frames in animations, as reported, or to allow fixed sizes with only color scaling.
If override features cannot be easily implemented in
Cone(...), then please consider those for future 3D-glyph mesh functions. Thanks in advance!
Meanwhile, I found a quick solution for a small dataset by adding each single vector with a separate cone trace and controlling the scaling through
sizemode,sizeref,cminandcmax. The size of each individual cone can then be controlled bysizeref, for instance to scale size by the unit vector.To see that effect in an animation, have a look at the modification of the example by @TakodaS below:
import numpy as np
import pandas as pd
import plotly.graph_objects as go
import plotly.offline as pl

t = np.linspace(0,2*np.pi,100)
dd = dict(
    x = np.around(np.vstack((np.cos(t), np.cos(t+np.pi))),decimals=6),
    y = np.around(np.vstack((np.sin(t), np.sin(t+np.pi))),decimals=6),
    z = np.around(np.vstack((np.ones(len(t)),np.ones(len(t)))),decimals=6),
    v = np.around(np.vstack((np.cos(t), np.cos(t+np.pi) * 1.5)),decimals=6),
    u = np.around(-np.vstack((np.sin(t), np.sin(t+np.pi) * 1.5)),decimals=6),
    w = np.around(np.vstack((np.zeros(len(t)),np.zeros(len(t)))),decimals=6)
    )

df = ( pd.concat([pd.DataFrame({k:pd.Series(v[n,:],index=t) for k,v in dd.items() }) for n in [0,1]],
                 axis=1,keys=[0,1])
      .rename_axis(index='t')
     )

figlayout = go.Layout(
    scene=dict(aspectratio=dict(x=1,y=1,z=0.25),
                    xaxis=dict(range=[-2,2], tickmode="linear"),
                    yaxis=dict(range=[-2,2], tickmode="linear"),
                    zaxis=dict(range=[0,5])))

# Fig3.
# current behaviour: more than one vector per trace activates automatic glyph scaling, scale varies between frames
fig3 = go.Figure(data = [go.Cone(anchor="cm",showscale=True,sizemode="scaled",sizeref=1,cmin=0,cmax=2,
                         **df.iloc[[0]].stack(level=0).to_dict(orient='list'))],
                 layout = figlayout)
fig3.frames = [ go.Frame(data = [{**{'type':'cone'}, **(df.iloc[[i]].stack(level=0).to_dict(orient='list'))}],
                        layout = go.Layout(title='Scaling depends on glyph positions')) for i in range(len(df)) ]


# as Fig3, but using a separate trace for each vector, bypasses automatic scaling algorythm
figx = go.Figure([go.Cone(anchor="cm",showscale=True,sizemode="scaled",sizeref=1,cmin=0,cmax=2,
                        **df.iloc[[0]].loc[:,n].to_dict(orient='list')) for n in [0,1]],
              layout=figlayout)

fig4 = go.Figure(figx)
fig4.frames = [ go.Frame(data = [{**{'type':'cone'}, **(df.iloc[[i]].loc[:,n].to_dict(orient='list'))} for n in [0,1]],
                        layout = go.Layout(title='Scaling <b>independent</b> of glyph positions')) for i in range(len(df)) ]

# Same, but cone glyph-size normalized (fixed)
def unitvector_cone(ds,mag_min=0.01,sizeref=1):
    uv = ( ds['u'][0]**2 + ds['v'][0]**2 + ds['w'][0]**2 )**.5
    sf = np.divide(np.ones_like(uv), np.array(uv), out=np.zeros_like(uv), where=uv!=0)
    sf = np.max([np.mean(sf),mag_min])*sizeref
    return ({**{'type':'cone', 'sizeref':sf}, **ds})

fig5 = go.Figure(figx)
fig5.frames = [ go.Frame(data = [ unitvector_cone(df.iloc[[i]].loc[:,n].to_dict(orient='list'),
                                                  sizeref=fig5.data[0]['sizeref']) for n in [0,1]],
                        layout = go.Layout(title='<b>Fixed</b> glyph size, color scaling')) for i in range(len(df)) ]

pl.plot(fig3,filename='temp-fig3.html')
pl.plot(fig4,filename='temp-fig4.html')
pl.plot(fig5,filename='temp-fig5.html')
I have not tested this on a large dataset.
Reacted by Scott ChowI came across the same issue. What I want to visualise is the direction in which a camera points along a trajectory. The cone plot seems prefect for this, but all I need is that all cones are constant size. However, this magic factor prevents makes it impossible.
An option to disable the factor would be greatly appreciated.
14 remaining items
I was really hoping to find a way to set the sizes of my cones by passing arrays of length same as number of cones, something a la matlab's
quiver. uniformly/explicitly sized cones would help me solve my problem of showing a 3d representation of a mathematical directed graph (not a graph of a function), coordinates for which are computed by networkx'sspectral_layoutfunctionality.i was able to get my direction vectors all unit length no problem, but i don't quite see the hint on adding a duplicate datapoint. i remain in search of a solution.
I also encountered problems with this. I want to plot some reactions of a structure with vectors that are comprised of single cones for forces, double-cones for moments. I can't stack the cones to save my life...
Hey Folks,
Ironically, I found myself here after trying to optimise my code.
Originally, I was doing one "cone plot" per cone. This was extremely laggy, but all the cones remained of unit size because the "mystery metric" could never be calculated.
So if you are desperate for a solution that works reliably, you can do that.
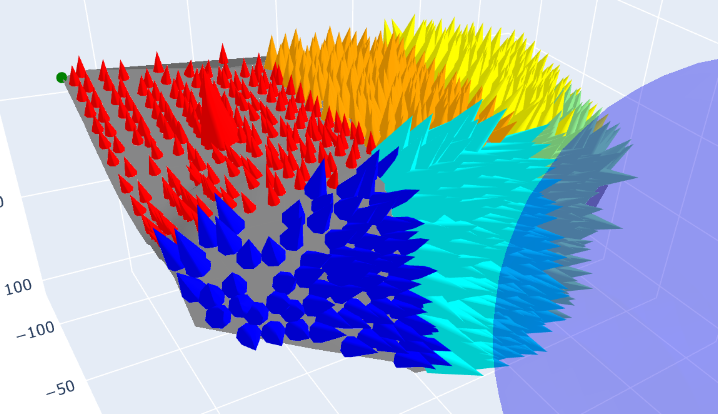
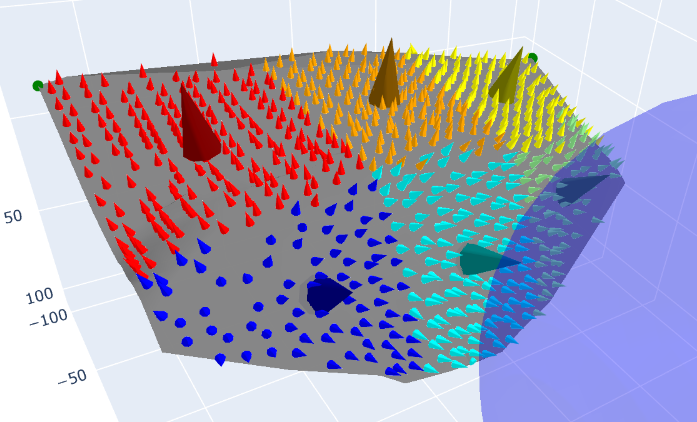
For my unique situation, I have 6 different sets I want to plot on the same figure. See the figure here:
As you can see, there scale varies wildy.
What I have ended up doing is setting a scaling factor, where I look at the original result, and then guess a "correction factor" for each colour.
    # Red, Orange, Yellow, Blue, Cyan, Green
    scaling_factors = [0, 2, 4, 2, 5, 4]

    # For Scaling Issue
    # https://github.com/plotly/plotly.js/issues/3613#issuecomment-1750709712
    for i, color in enumerate(ACA_COLORS.values()):
        triangles = [
            triangle for triangle in normals_data if triangle.color == color
        ]
        fig.add_trace(
            go.Cone(
                x=[triangle.centroid[0] - com[0] for triangle in triangles],
                y=[triangle.centroid[1] - com[1] for triangle in triangles],
                z=[triangle.centroid[2] - com[2] for triangle in triangles],
                u=[triangle.normal[0] for triangle in triangles],
                v=[triangle.normal[1] for triangle in triangles],
                w=[triangle.normal[2] for triangle in triangles],
                colorscale=[
                    [0, color],
                    [1, color],
                ],
                showscale=False,
                sizemode="absolute",
                sizeref=7 - scaling_factors[i],
                anchor="tail",
            )
        )
I understand for many usecases this is not a good fix. I also tried #3613 (comment) by appending a duplicate triangle with triangle.centroid changed slightly, but that did nothing.
I have been able to work around it by following @z--m-n 's approach of adding cones one at a time, but it is much slower, especially in longer trajectories with many cones. If we had the ability to specify the color and size of the cones manually with arguments, it would be much more convenient and faster.
If you continue to depend on that approach, even after the wonderful new features proposed by @archmoj, consider updating existing traces, instead of re-creating scenes with new traces, for each time step. Particularly for a fixed amount of cones, updating location and orientation of established traces is much faster than creating new ones. At least, fast enough for generating animations (example: https://doi.org/10.5446/50229)
Is a workaround still necessary? I'm confused.
Dear Dr. @gvwilson Hi,
Cone size if we could control it correctly helps us in our plots. As, you see on this issue, many of users have problem on controlling the size of this valuable element on Plotly. That would be great if I could know your idea or if you had any comments on it.
Thanks
Thanks @BijanSeif - I'll see what I can find out.
Reacted by Bijan SayyafzadehYou could now use
sizemode="raw".
Please see the example that this new option here: https://plotly.com/python/cone-plot/You could now use
sizemode="raw".Dear @archmoj, Firstly, thanks for your contribution. Take a look at the following code:
import plotly.graph_objects as go
import random as rnd

fig = go.Figure()

u=[]
v=[]
w=[]
xx=[]
yy=[]
zz=[]

for i in range(20):

    u.extend([rnd.randint(0,2),None])
    v.extend([rnd.randint(0,2),None])
    w.extend([rnd.randint(0,2),None])
    xx.extend([rnd.randint(0,20),None])
    yy.extend([rnd.randint(0,20),None])
    zz.extend([rnd.randint(0,20),None])

sizes=5
fig = fig.add_cone(sizemode='raw',sizeref=sizes,#colorscale=['red','red'],
                   x=xx, y=yy, z=zz, u=u, v=v, w=w,)
fig.show()
In the following picture, the result of the above code has been shown:

You can see the size of cones are not equal and depend on the location and maybe direction (velocity) of each cone, size of cones has changed and are not equal. (Plotly Version: 5.22.0)
You could now use
sizemode="raw".Dear @archmoj, Firstly, thanks for your contribution. Take a look at the following code:
import plotly.graph_objects as go
import random as rnd

fig = go.Figure()

u=[]
v=[]
w=[]
xx=[]
yy=[]
zz=[]

for i in range(20):

    u.extend([rnd.randint(0,2),None])
    v.extend([rnd.randint(0,2),None])
    w.extend([rnd.randint(0,2),None])
    xx.extend([rnd.randint(0,20),None])
    yy.extend([rnd.randint(0,20),None])
    zz.extend([rnd.randint(0,20),None])

sizes=5
fig = fig.add_cone(sizemode='raw',sizeref=sizes,#colorscale=['red','red'],
                   x=xx, y=yy, z=zz, u=u, v=v, w=w,)
fig.show()
In the following picture, the result of the above code has been shown:

You can see the size of cones are not equal and depend on the location and maybe direction (velocity) of each cone, size of cones has changed and are not equal. (Plotly Version: 5.22.0)
Since you are using random numbers as u, v, w vector, the actual size of the vector is different from each other.
If you are interested to draw vectors of equal size, you should normalize the vector i.e.r = sqrt(u*u+v*v+w*w) u /= r v /= r w /= rHere is a codepen illustrating the raw sizemode and orthographic project.
r = sqrt(uu+vv+w*w)
u /= r
v /= r
w /= rDear @archmoj you are completely right, and it's working for me. I just put the final code here for others if had same issue. Again thanks.
import plotly.graph_objects as go
import random as rnd
import math

fig = go.Figure()

u=[]
v=[]
w=[]
xx=[]
yy=[]
zz=[]

for i in range(20):

    u0=1
    v0=rnd.randint(0,2)
    w0=rnd.randint(0,2)

    r = math.sqrt(u0*u0+v0*v0+w0*w0)
    u0 /= r
    v0 /= r
    w0 /= r

    u.extend([u0,None])
    v.extend([v0,None])
    w.extend([w0,None])
    xx.extend([rnd.randint(0,50),None])
    yy.extend([rnd.randint(0,50),None])
    zz.extend([rnd.randint(0,50),None])

sizes=5
fig = fig.add_cone(sizemode='raw',sizeref=sizes, colorscale=['red','red'],
                   x=xx, y=yy, z=zz, u=u, v=v, w=w,)
fig.show()
Dear Dr. @gvwilson, my problem by help of @archmoj has solved, and thanks for your attention.
Issue originally posted at plotly/plotly.py#1443
If I understand the documentation correctly there is no way to manually scale the cones in the plot units. Even when using sizemode='absolute' there is some magic rescaling of the length of the cones.
I would expect a way to use the norm of the (u,v,w) vector directly as the length of the cones, but this is not really possible unless you understand how the scaling factor is computed.